Microsoft Access is a Relational Database Management System (RDBMS), designed primarily for home or small business usage.
Access is known as a desktop database system because it's functions are intended to be run from a single computer. This is in contrast to a server database application (such as SQL Server), where it is intended to be installed on a server, then accessed remotely from multiple client machines.
Microsoft (or MS) Access is a software package that you install just like any other software package, and is bundled as part of the Microsoft Office suite.
Microsoft Access - Create a Database
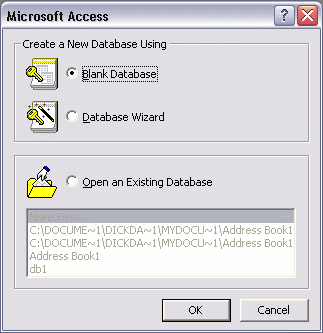
- You may notice that, whenever you start Microsoft Access, you see the following screen. In this case, you can simply select "Blank Database".
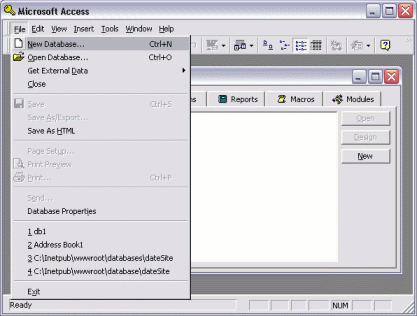
 If you already have Access open, you can go to the "File" menu and click on "New Database":
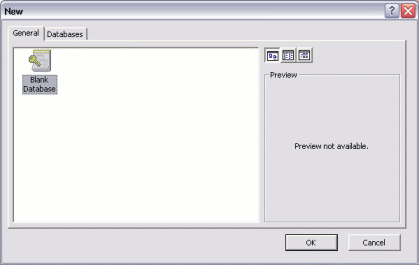
- Choose "Blank Database". (Skip this step if you already chose "Blank Database" at step one). You also have the ability to choose from a template, but we'll just use a blank database here:
- Choose a location to save the database:
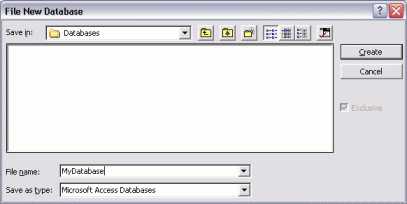
Your New Database
Once you've completed the above tasks, you should see a blank database, like this: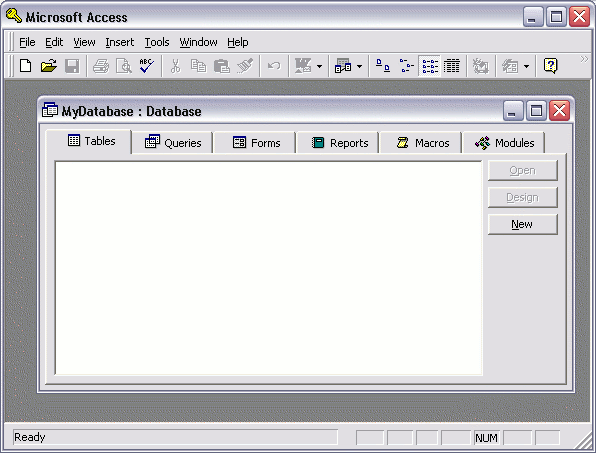 We know this database is blank because it doesn't have any tables. If it did, you would see these tables in the middle pane of the table tab. Now that we have our blank database, we can start adding some tables.
Microsoft Access - Create a Table
With database management systems, you need to create your tables before you can enter data. Microsoft Access makes creating tables a breeze.
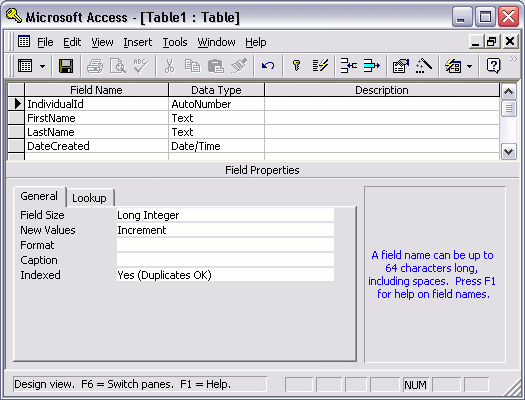
Using our blank database from a previous lesson, we are going to create a table called Individual. This table will have 4 columns: IndivdidualId, FirstName, LastName, and DateCreated.
Using our blank database from a previous lesson, we are going to create a table called Individual. This table will have 4 columns: IndivdidualId, FirstName, LastName, and DateCreated.
Design View
"Design View" enables you to create your database tables and specify the columns and their data types etc. The following steps demonstrate how to switch to Design View and create a table.- Ensuring you have your blank database open and you're on the following screen (with the "Tables" tab selected), click "New":

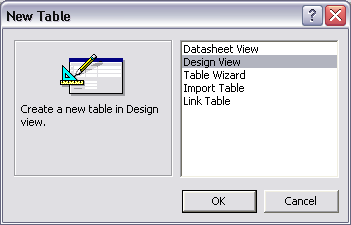
- Select "Design View" and click "OK":
- Fill out the details in the "Field Name" column and the "Data Type" column. Here, we are creating the column names and specifying the type of data that can be entered into them. Restricting the data type for each column is very important and helps maintain data integrity. For example, it can prevent us from accidentally entering an email address into a field for storing the current date.Other options for each column include restricting the length of data (under "Field Size"), setting a default value (this is used if someone leaves the field blank), specifying whether the data is required, and more. Leave these options with their default value for now.
- Click the "Save" icon, enter the table name ("Individual"), and click "OK":
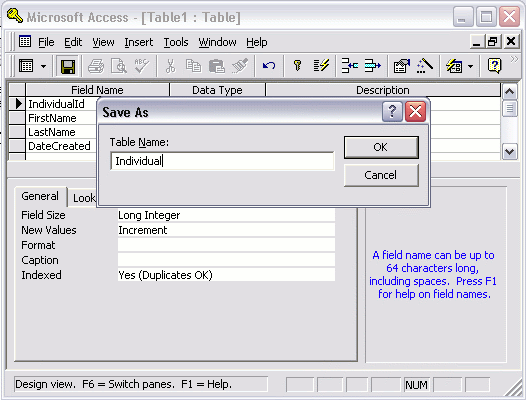
- When prompted to set a primary key, click "Yes". (A primary key ensures that the data in this column is unique - no two values can be the same. This is important for when you need to select or reference data from this column):

Datasheet View
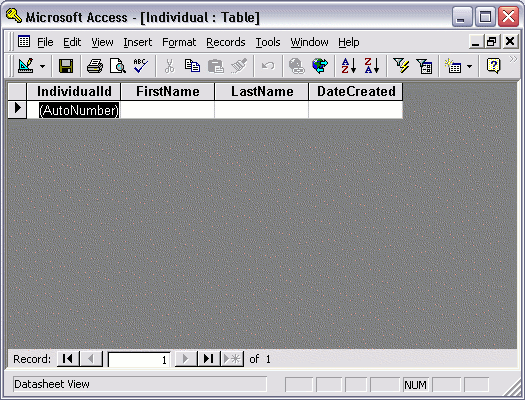
You have now created a database table called "Individual". You can now switch between "Design View" and "Datasheet View" as you wish. Datasheet View allows you to see any data that has been entered into the table.- From the "View" dropdown icon, click "Datasheet View" (this changes the view from Design View, to Datasheet View):
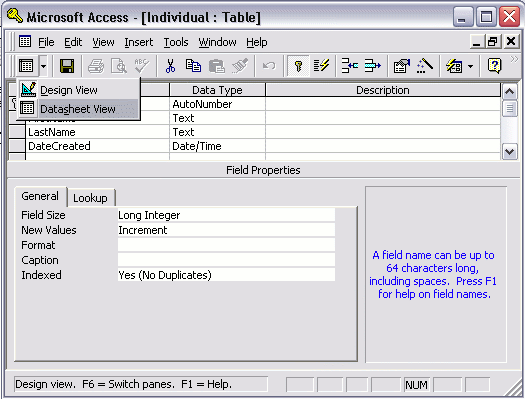
- You should now see something like this:
Microsoft Access - Create a Form
As mentioned in the previous lesson, forms provide non-technical users the ability to add data to your database.
Here are the steps involved in creating a form in Access.
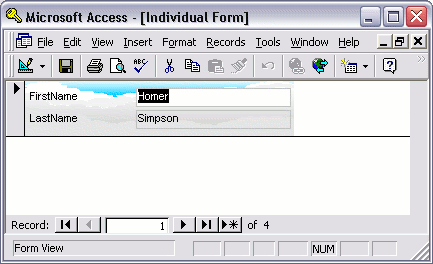 This is a very basic form and in most cases, you'd have a lot more fields on your form. You can see that the form is already presenting the first record in our Individual table.
Here are the steps involved in creating a form in Access.
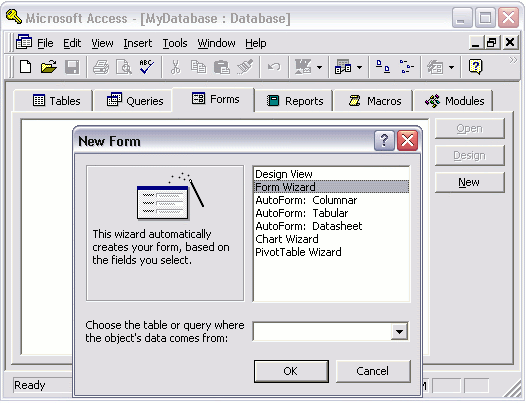
- Ensuring the "Forms" tab is selected, click "New".
- Select "Form Wizard" and click "OK". (For now, we'll use the "Form Wizard" to create a form. Once you become comfortable with creating forms, you can choose another option if you prefer).
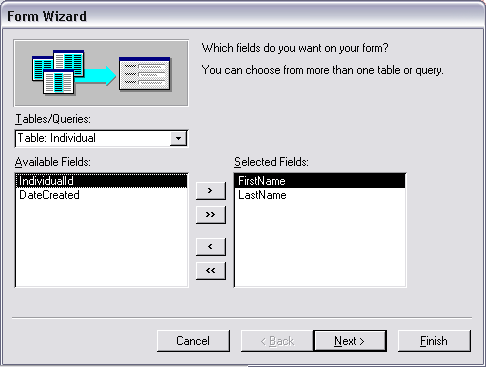
- Select the fields that you need on your form and click "Next". In this case, we only need the user to enter first name and last name, so we choose those two fields:
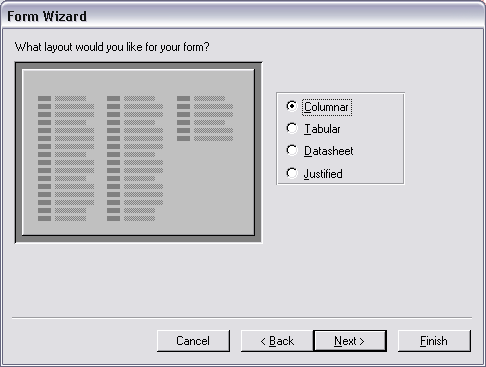
- Choose which layout you'd like your form to use. Leave this at the default ("Columnar") and click "Next":
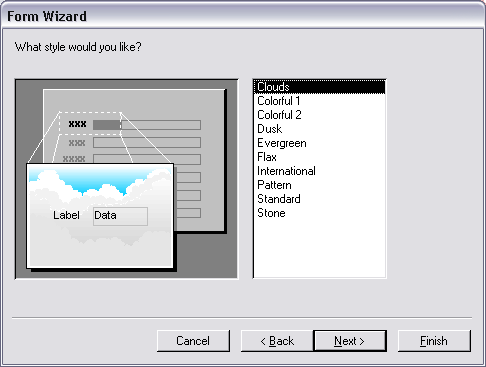
- Choose which style you'd like your form to use. Leave this at the default ("Clouds") and click "Next":
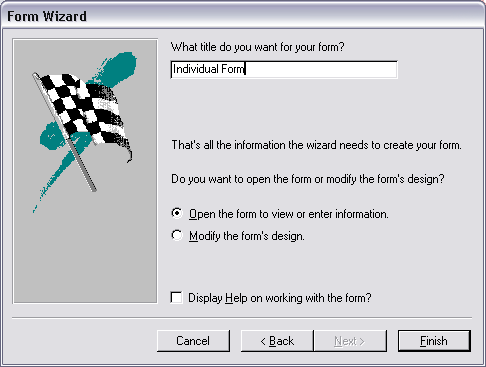
- Choose a name for your form and click "Finish":
 This is a very basic form and in most cases, you'd have a lot more fields on your form. You can see that the form is already presenting the first record in our Individual table.
- To jump to the next record, click the
 button.
 - To jump to the last record, click the
 button.
 - To jump past the last record so that it's blank and ready for a new record to be entered, click the
 button
Microsoft Access - Create a Query
A "query" refers to the action of instructing the database to return some (or all) of the data in your database. In other words, you are "querying" the database for some data that matches a given criteria.
For example, you might like to see a list of all individuals whose first name is "Homer". Or you might like to see a list of all users who have registered with your database over a given time period. To do this, you need to do a query.
Here's how to create a query in Microsoft Access:
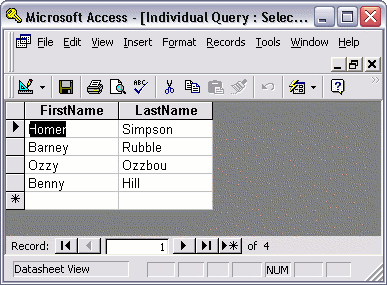 At this stage, you may be thinking that there's not much difference between the results of our query and our table. We can still see all records from our table. The only difference is that we can only see 2 fields instead of all 4 fields.
Well if that's what you're thinking, you'd be right! In our next lesson, we're going to modify our query so that we can only see some of the results.
For example, you might like to see a list of all individuals whose first name is "Homer". Or you might like to see a list of all users who have registered with your database over a given time period. To do this, you need to do a query.
Here's how to create a query in Microsoft Access:
- Ensuring you have the "Query" tab open, click "New"
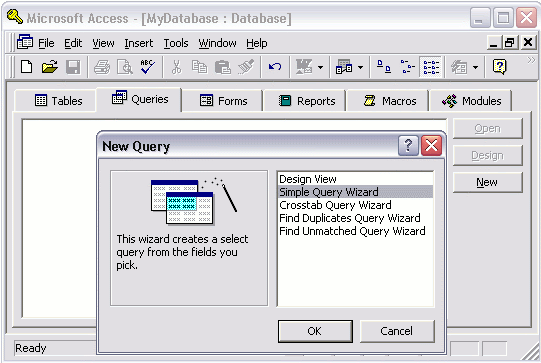
- Select "Simple Query Wizard" and click "OK":
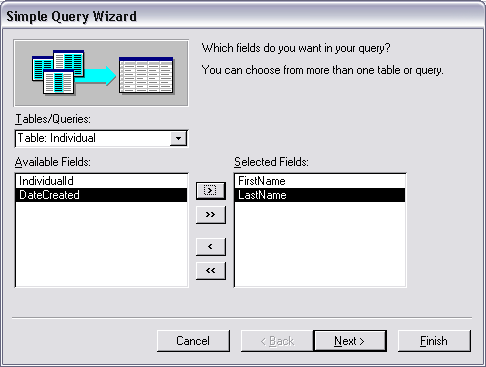
- Choose the fields you'd like to be presented in the results of your query. To choose 1 field at a time, select it and click the ">" arrow. To choose all fields click the ">>" arrows. For now, just select the "FirstName" and "LastName" fields, then click "Next":
- Choose a name for your query and click "Finish":
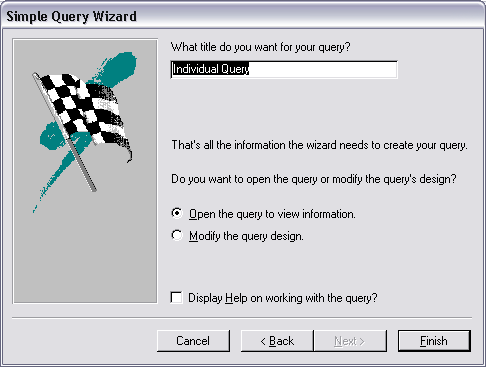
The Result
You should now see something like this: At this stage, you may be thinking that there's not much difference between the results of our query and our table. We can still see all records from our table. The only difference is that we can only see 2 fields instead of all 4 fields.
Well if that's what you're thinking, you'd be right! In our next lesson, we're going to modify our query so that we can only see some of the results.
Microsoft Access - Create a Report
Reports organize and summarize data for viewing online or for printing. A detail report displays all of the selected records. You can include summary data such as totals, counts, and percentages in a detail report. A summary report does not list the selected records but instead summarizes the data and presents totals, counts, percentages, or other summary data only. Access has several report generation tools that you can use to create both detail and summary reports quickly. This lesson teaches you how to create reports.
Use the Report Button
The Report button creates a simple report that lists the records in the selected table or query in a columnar format.
To use the Report button:

- Open the Navigation pane.
- Click the table or query on which you want to base your report.
- Activate the Create tab.
- Click the Report button in the Reports group. Access creates your report and displays your report in Layout view. You can modify the report.
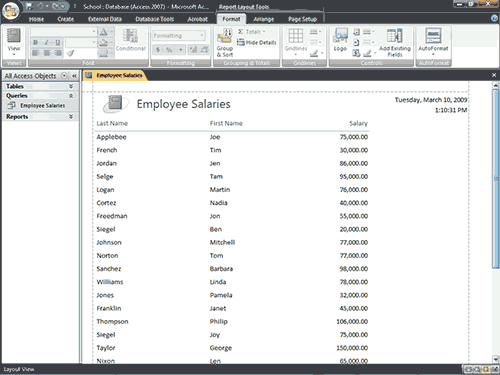
- Click the Save button on the Quick Access toolbar. Access saves the report unless you are saving for the first time. If you are saving for the first time, the Save As dialog box appears.
- Type the name you want to give your report.
- Click OK. Access saves the report. You can now access the report by using the Navigation pane.
As with other objects, you can also save a report by right-clicking the reports tab and selecting Save. Saved reports appear in the Navigation pane.
 Tip: Reports created by using the Report button are plain and simple. The Modify a Report section of this lesson teaches you how to customize a report to meet your needs.
Sections of a Report
| |
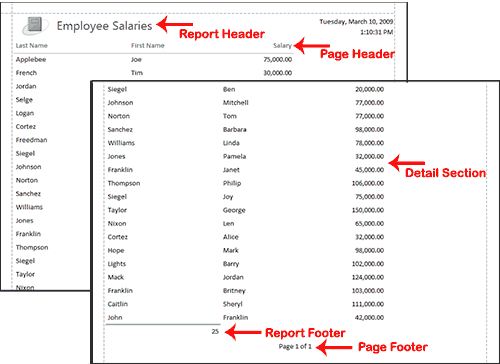
| Report Header | Appears at the top of the first page and displays the report title. |
| Page Header | Appears at the top of every page and displays the headings (field labels) for each column. |
| Page Footer | Appears at the bottom of every page and displays the page number and total number of pages. |
| Detail Section | Appears between the page header and page footer and displays the records from the table or query. |
| Report Footer | This section is optional. Appears on the last page of the report and displays summary information such as grand totals. |
Use the Report Wizard
You can also use the Report Wizard to create a report. The Report Wizard provides you with more flexibility than you get by using the Report button. You can choose the tables and fields, group the data, sort the data, summarize the data, choose a layout and orientation, apply a style, and title your report. Follow the steps shown here to create a report by using the Report Wizard:
To create a report by using the Report Wizard:
Open the Report Wizard

- Activate the Create tab.
- Click Report Wizard in the Reports group. The Report Wizard appears.
Select tables, queries and fields
When using the Report Wizard, you can use fields from multiple tables and/or queries if the tables/queries have a relationship.
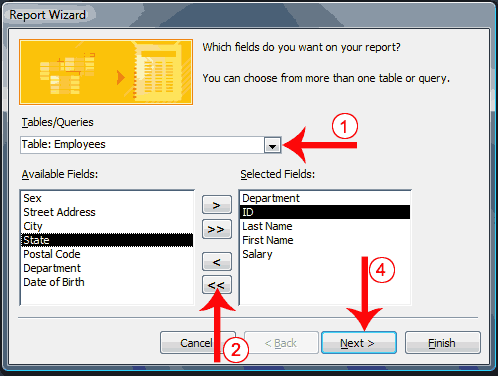
- Click the down-arrow next to the Table/Queries field and then click the table from which you want to select fields.
- Click a field and then click the single-right arrow to select a single field, click the double-right arrows to select all fields, click a field and then click the single-left arrow to deselect a single field, or click the double-left arrow to deselect all fields.
- Repeat steps 1 and 2 for each table from which you want to select fields.
- Click Next. The Report Wizard moves to the next page.
Group
When using the Report Wizard, you can group data. Grouping puts all of the values in a field into a group based on the field’s value. For example, if your data is grouped by the Department field and the records in the Department field have values such as Administration, Computer Science, and English. Access will group all of the data for the Administration department together, all of the data for the Computer Science department together, and all of the data for the English department together.
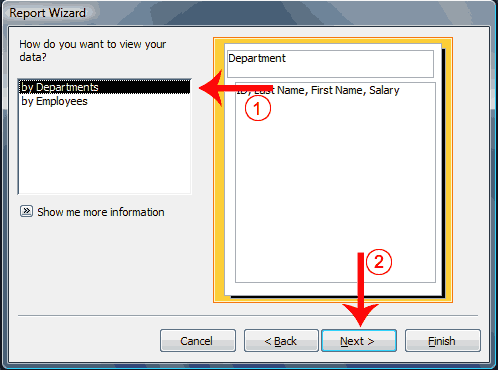
- Click to select the field by which you want to group your data. You may not see this page of the wizard if you are selecting data from a single table.
- Click Next. The Report Wizard moves to the next page.
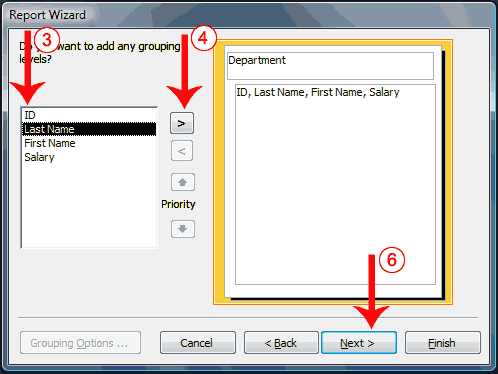
- Click a field you want to group by.
- Click the right-arrow to select a field; click a field and then click the left arrow to deselect a field. Use the up- and down-arrows to change the order of the groupings. If you are only using one table, this may be your first opportunity to select a field to group by.
- Repeat steps 3 and 4 for each field you want to group by.
- Click Next. The Report Wizard moves to the next page.
Sort and summarize
By using the Report Wizard, you can create up to four levels of sort. Access sorts the first level, and then sorts the second level within that sort, and so on. If you have grouped your data, you can summarize it by displaying the sum, average, and minimum or maximum value for each numeric field. You can choose to have your report display just the summary data or each detail line and the summary data. There is also an option that allows you to display the percent the sum of each group is of the grand total. All of the fields in your report may not fit on a single page. You can have Access automatically adjust the size of the font so that every field fits.
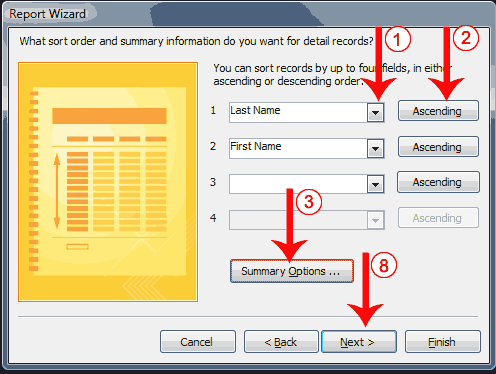
- Click the down-arrow and then select the field you want to sort by.
- Click the button to choose ascending or descending order. Clicking the button toggles between Ascending and Descending. You can sort up to four levels.
- Click the Summary Options button. The Summary Options window appears.
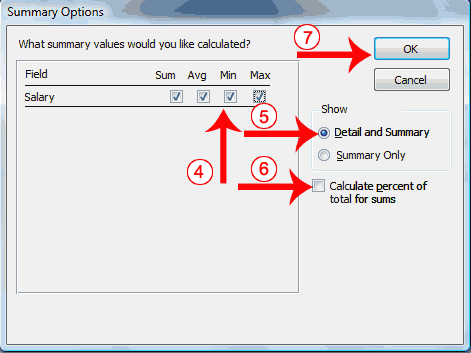
- Click to select the summary data you want.
- Click to select whether you want detail and summary data or if you want summary data only.
- Click if you want to calculate the percent to the total for sums.
- Click OK. The Summary Options window closes.
- Click Next. The Report Wizard moves to the next page.
Layout and orientation
You can choose the layout and orientation of your report. The layout determines where each field appears on the page. Access provides three options to choose from: Stepped, Block, and Outline. When you choose an option, the left side of the window displays a graphic of the layout.
Orientation determines whether Access creates the report in portrait or landscape. Most paper, such as paper sized 8 1/2 by 11, is longer on one edge than it is on the other. If you print in Portrait, the shortest edge of the paper becomes the top of the page. Portrait is the default option. If you print Landscape, the longest edge of the paper becomes the top of the page.
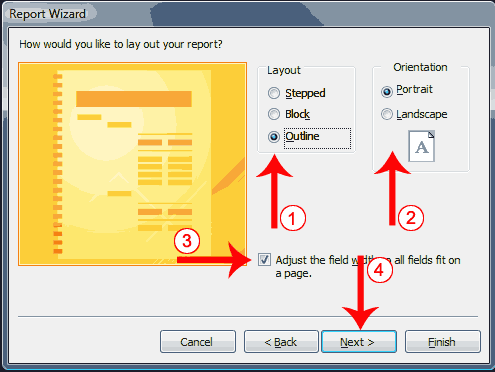
- Click to select a layout.
- Click to select a page orientation.
- Choose the Adjust The Field Width So All Fields Fit On A Page option if you want all fields to fit on a single page.
- Click Next. The Report Wizard moves to the next page.
Style
A style is a set of formats consisting of such things as background colors, fonts, font colors, and font sizes. Access supplies predesigned styles that format titles, labels, and more. When you choose a style, the left side of the window displays a preview.
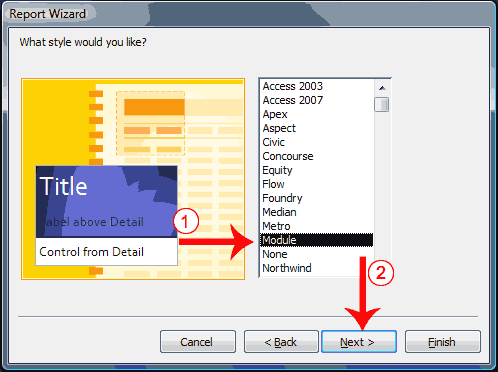
- Click to select a style.
- Click Next. The Report Wizard moves to the next page.
Create a title
On the final page of the Report Wizard, you can title your report. The title appears at the top of the report and on the Navigation pane.
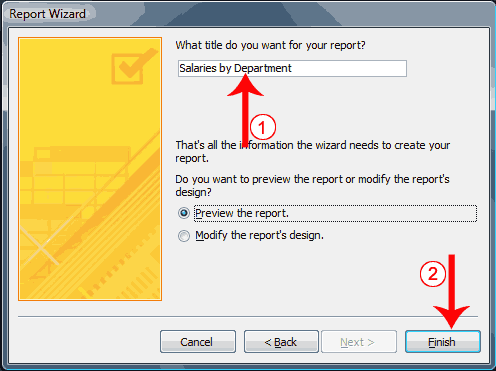
- Type the title you want to give the report.
- Click Finish. Access creates, saves, and opens your report in Layout view.
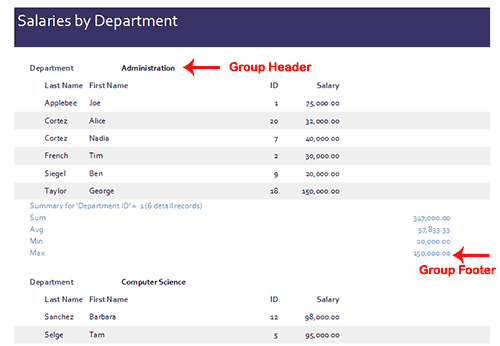
Sections of a Report
| |
| Group Header | Appears before a group and displays information about the group. |
| Group Footer | Appears after a group and summarizes the group data. |
